 Give Today
Community Foundation Releases New Community Maps
Community Foundation shares maps featuring area demographics, service providers
By: BROOKE MCAFEE
The News and Tribune, July 26, 2018
SOUTHERN INDIANA — A recent project from the Community Foundation of Southern Indiana is meant to address needs in Clark and Floyd counties and provide a public resource to identify local service providers.
On Tuesday, the Community Foundation met with staff from local nonprofits to discuss a series of maps the organization released as part of its Community Needs Assessment, created by the Indiana University Southeast Applied Research and Education Center.
The project began with a report, released in 2015, examining community needs, priorities for funding and goals for addressing issues in Clark and Floyd counties. The foundation also released a resource guide with a listing of local nonprofits. Both are available on the Community Foundation website.
The Community Foundation is regularly using the assessment to make sure the grants from its Community Impact Fund are applied to areas where they are most needed, Director of Philanthropy Crystal Gunther said.
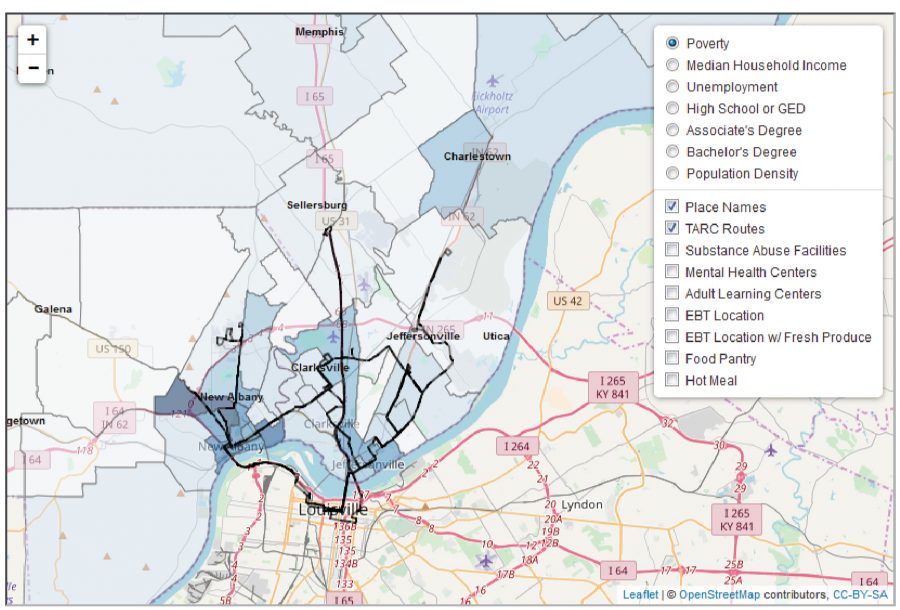
The community maps are the third phase of the needs assessment project. The foundation’s website features an interactive map with base layers of demographic data from the area’s census tracts, including poverty levels, median household income, unemployment, population density and education levels in Clark and Floyd counties.
After selecting a base layer, the user can then add other layers to the map, including locations of TARC routes, substance abuse facilities, mental health centers, adult learning centers, food pantries, Electronic Benefits Transfer (EBT) locations and hot meals in the area.
The mapped service providers were included based on needs identified by the community in the foundation’s assessment, Gunther said. The report discussed mental health and substance abuse issues, homelessness, high poverty rates and low educational attainment rates.
The interactive map is meant to provide everyone in the community with a visual of the area’s nonprofit landscape, Gunther said. While it can be a helpful tool for nonprofits, it can also help any organization, business or community member find resources.
The Community Foundation also released a map appendix to the needs assessment and resource guide, also available on its website. It shows the same information across a collection of static maps, with the addition of census tract data for Scott, Washington and Harrison counties. These would be particularly useful for service providers who are writing grant proposals, Gunther said.
The set of static maps also provides explanations of what is shown in the maps. For example, it analyzes the dynamics of poverty in rural versus urban areas.
Melissa Fry, director of the IUS Applied Research and Education Center, said she wants the maps to be used as a tool to help people better understand the issues they are trying to address in the community.
“My interest is really to provide more interests and resources to help people make better decisions,” she said. “I think the more we look at the data on our region, the more we understand what’s really going on. There’s always an important geography to that. There’s always a difference between people in certain areas.”
If someone came into a library asking where the nearest hot meal program is located, a librarian would be able to guide that person to the right place with the interactive map, Fry said. It could easily be used by anyone sitting at the front desk of a business or organization, even if they do not provide the specific service the person is looking for.
The maps can help users examine issue like health and nutrition, Fry said. It shows many locations that accept EBT, but far fewer EBT locations with fresh produce. It shows an active network of hot meal providers along TARC routes in New Albany and Jeffersonville.
The TARC routes are an important element of the interactive map, Fry said, because it shows whether people without cars have access to service providers. A few years ago, TARC cut its route on Charlestown Road, and she is concerned that it may have hit people dependent on services in that area.
The interactive map is also intended to help service providers with planning. Even if there are plenty of food pantries in the area, it can be complicated for people to navigate the hours and days of operation and limitations on how often they can visit, Fry said. They might not always be able to access those services when they most need them.
If organizations see gaps or overlap in services on the interactive map, they could potentially change their hours or days of service to complement other providers in the area, she said. The map includes days and hours of operation along with other relevant information.
Keeley Stingel, executive director of the Homeless Coalition of Southern Indiana, said she believes the interactive map will be a useful tool for the nonprofit. She expects to use the map in the organization’s next White Flag Emergency Shelter to direct guests to hot meals and food pantries.
Ann Carruthers, Systems of Care coordinator for Clark and Floyd counties, works with local mental health care providers, and she plans to use the interactive map to guide people to the information and resources they need to get on the road to recovery, she said.
“We can pull this map up and say, hey, look, let’s see where you are, because a lot of it is just them not knowing that it could be around the corner,” she said. “We want to enlighten them and empower them on what is actually in their communities.”